Floodplain determination
The extent of the floodplain inundation on December 31, 2005 was 7062 acres (11 square miles). Most of the floodplain’s extent remained below the NGVD29 (National Geodetic Vertical Datum of 1929) elevation of 72 feet; with large portions of the Mark West Creek area remaining below 70 feet. Floodplain elevation heights increased by 24 feet in the area south of Sebastopol towards Cotati and Rohnert Park. The maximum elevation of the out-of-bank floodplain was 94 feet.
As a first step in characterizing the flood’s elevation, I obtained two digital elevation models which together spanned the floodplain from the Russian River confluence to the triple junction of Gossage–Hinebaugh–Laguna near the western edge of Cotati.
 The first dataset—obtained from John Monahan, Surveyor, Sonoma County Water Agency—has vertical and horizontal data obtained from a 2001 aerial flight commissioned by the US Army Corps of Engineers. This was supplied to me in an ArcGIS shapefile (2001_Aerial_dwg_Polyline.shp), but was originally sourced in CAD-file format. One-foot vertical accuracy is possible to obtain from the dataset, with an unspecified horizontal accuracy presumed to be better than ten feet. This dataset yielded elevation and position data with the best accuracy. Unfortunately the dataset does not cover the area southeast of the Laguna Treatment Plant at Llano Road or the portion of Abramson–Santa Rosa creeks east of Willowside Road
The other dataset, obtained from the USGS Seamless download Web site, is a 10-meter digital elevation model spanning the county of Sonoma. I used the ArcGIS “contour” tool to create 1-foot contours from this dataset. It has a positional accuracy of 7- to 15-meters, an acceptable error for this floodplain mapping project; nevertheless, small adjustments were made during the tracing process to adjust for obvious positional errors where creeks meet roads.
Using the ArcGIS trace tool, I used the 2001 Aerial dataset to trace the outlines of 1- and 2-foot contours. For areas not covered by the 2001 Aerial dataset, I used the USGS-DEM to trace 1-foot contours.
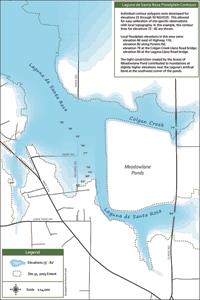
This was a labor-intensive operation, and coverage was attempted strategically to capture the entire vertical and horizontal floodplain, plus a small buffer. Upon completion, 47 polygons were developed representing iso-heights from 33 through 93 feet NGVD29, as follows:
- 33–40 feet: in 1-foot increments, obtained from the SCWA dataset, covering the Mark West water course from the Russian River to Trenton Healdsburg Road.
- 42–72 feet: in 2-foot increments, obtained from the SCWA dataset, covering the core floodplain area from the Russian River to Llano Road.
- 73 feet: obtained from the USGS dataset, covering the area east of Abramson Creek and the area southeast of Willowside Road.
- 73–78 feet: in 1-foot increments, obtained from the USGS dataset, covering the floodplain south of Highway 12 to Llano Road.
- 79–84 feet: in 1-foot increments, obtained from the USGS dataset, covering the floodplain from about Cooper Road to Stony Point Road.
- 85–87 feet: in 1-foot increments, obtained from the USGS dataset, covering the floodplain from the Meadowlane Ponds to Wilfred Lane.
- 88–91 feet: in 1-foot increments, obtained from the USGS dataset, covering the floodplain from Arlington at Wilfred to Millbrae Ave.
- 92–93 feet: in 1-foot increments, obtained from the USGS dataset, covering the floodplain east of Stony Point Road.

