Calibration
The reconnaissance observations taken immediately after the December 30–31 storm provide the first line of evidence for modeling the extent of the floodplain. But since no equipment was used to measure the elevation of the flood waters, the observations need outside reference data before they can be used to extrapolate to unobserved regions of the floodplain.
As a rough measure of calibration, I used a series of eleven printed maps—on the day of the reconnaissance—to estimate flood water elevation. These maps were specially created the night before (December 30, 2005) and showed 1-foot contour intervals, as derived from the USGS 10-meter DEM for Sonoma County, together with roads, parcel lines, and stream courses. For purposes of field observation, these detailed field maps provided assistance with determining elevation estimates in situ, and were especially useful for correcting perspective problems for distant objects.
 Some time after the reconnaissance, I transferred the original field observations into an ArcGIS shapefile, using a combination of three techniques to estimate the elevation of each flood water observation.
First, pencil lines—of the flood water edge—drawn on the work maps while in the field, were examined for rough estimation purposes.
Second, GPS data of photo points were layered into the GIS system, together with aerial imagery, and used to reposition myself to the same frame of reference as the panoramic photographs taken at each spot. Trees, structures, and fence lines were examined in the photographs and compared to the GIS frame of reference. Boundary edges of the flood water were drawn free-hand into a GIS shapefile and labeled with the event timestamp and the IDs of the photographs referenced in the process.
Third, the GIS shapefile containing the flood water edges was overlaid onto the elevation contours traced from the SCWA and USGS elevation datasets (Aerial 2001 dataset from SCWA, and 10-meter DEM from USGS; discussion follows in next chapter.) For each flood edgeline, estimates were made of its observed elevation by reading the elevation contour values from the GIS datasets.
Elevation reference data
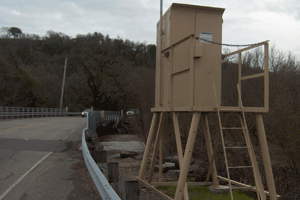
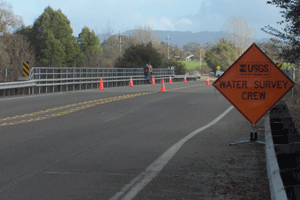
 Outside reference data was obtained for the event from six USGS gauges: Laguna at Stony Point Road; Colgan Creek at Llano Road; Laguna at Occidental Road; Santa Rosa Creek at Willowside Road; Laguna at Guerneville Road; and Mark West Creek at Trenton-Healdsburg Road.
- USGS 11465680: Laguna de Santa Rosa at Stony Point Road near Cotati California; on right bank, upstream side of Stony Point Road bridge, 300 ft downstream of unnamed tributary, and 1.5 mi west of Rohnert Park; Latitude 38°21’08”, Longitude 122°44’35” referenced to North American Datum of 1927; vertical datum of NGVD of 1929; 40.8 square mile drainage.
- USGS 11465700: Colgan Creek near Sebastopol California; on left bank, downstream side of Llano Road bridge, 0.5 mi upstream of Laguna de Santa Rosa, and 3.5 mi southeast of Sebastopol; Latitude 38°22’25”, Longitude 122°46’02” referenced to North American Datum of 1927; 6.78 square mile drainage area.
- USGS 11465750: Laguna de Santa Rosa near Sebastopol California; on right bank, upstream side of Occidental Road bridge, and 1.6 mi north of Sebastopol; Latitude 38°25’32”, Longitude 122°49’41” referenced to North American Datum of 1927; vertical datum of NAVD 1988; 79.6 square mile drainage area.
- USGS 11466320: Santa Rosa Creek at Willowside Road near Santa Rosa California on right bank, upstream side of Willowside Road bridge, 1.6 mi upstream of the confluence of Laguna de Santa Rosa, and 5.4 mi west of Santa Rosa; Latitude 38°26’43”, Longitude 122°48’22” referenced to North American Datum of 1927; 77.6 square mile drainage area.
- USGS 11466500: Laguna de Santa Rosa near Graton California; on left bank, at highway bridge on Guerneville Road, 0.2 mi downstream from Santa Rosa Creek, 2 mi northeast of Graton, and 6 mi west of Santa Rosa; Latitude 38°27’10”, Longitude 122°50’03” referenced to North American Datum of 1927; vertical datum of NGVD of 1929.
- USGS 11466800: Mark West Creek near Mirabel Heights; on downstream side of bridge, on right bank, 0.7 mi north of Trenton, and 3.0 mi upstream of confluence of the Russian River; Latitude 38°29’39”, Longitude 122°51’08” referenced to North American Datum of 1927; 45 feet above sea level, vertical datum of NGVD of 1929; 251 square mile drainage area.
The data from these stations were downloaded from the Internet on January 9, 2006. These data were captured in real time, at 15-minute increments, and include stage (elevation), reported in feet above NGVD29; and discharge, reported in cubic feet per second.
The real-time equipment at Mark West near Mirabel Heights for measuring discharge went offline throughout the event; final published data for discharge are available only on a mean daily basis.
The gauge on the Laguna at Guerneville Road does not measure discharge: it only measures stage every six hours. I was unable to obtain the 6-hour incremental data, and have relied on the one daily instantaneous value taken at midnight throughout the event.
Data obtained from USGS real time gauges was marked provisional at the time it was obtained. The final archived data that are available on the Internet shows only one data point per day. I have chosen to use the provisional data for calibration purposes.
USGS provisional data statement: “The data you have obtained from this automated U.S. Geological Survey database have not received Director’s approval and as such are provisional and subject to revision. The data are released on the condition that neither the USGS nor the United States Government may be held liable for any damages resulting from its use.”
Tide data for Point Reyes Station was obtained from NOAA historical data archives (http://tidesandcurrents.noaa.gov).
Tables 3-1 and 3-2, in the book "Another New Year's Eve Freshet," list the hourly data—for precipitation, tides, stage, and discharge—for the 120-hour period from the start of the rain at midnight December 30, 2005 through the first five days of the event. The final return to pre-storm levels occurred on January 4, at 4 P.M.
Elevation calibration
Using these data, I refined the original elevation estimates of the flood water edge to better fit the event. As the reconnaissance progressed, the flood crest moved away from Rohnert Park and arrived almost to the southern side of Sebastopol. Observations taken throughout the day were either slightly ahead or slightly behind the maximum extent of the flood. The peak stage readings for the six gauges was used to define a quick model of the floodplain’s maximum elevation throughout the watershed. From these six control points, the elevation of each datapoint in the “water’s edge” GIS shapefile was interpolated, after making an appropriate adjustment for time before, or time after, the flood’s crest.

