Reconnaissance
Before the big event of December 31, 2005, was another big event, that played out three days earlier. Beginning just as morning dawned on December 27th, a major Pacific storm blustered through the region, dropping 2.59 inches of rain before it petered out the following morning.  This event caused the Laguna’s stage gauge at Stony Point Road to shoot up more than eight feet, as runoff entered the Bellevue-Wilfred channel, Copeland, Gossage and Hinebaugh creeks, and smaller tributaries in the region, all sending their waters at once to the constricting confluence under the Stony Point Road bridge. The gauge read 86.72 feet by 9:30 A.M. on December 28th: low enough to keep water flowing under the bridge by about two feet, but high enough to close down Rohnert Park Expressway just to the east.
While the waters subsided the following day, the newspaper headlines were beginning to talk about “Gearing up for the next onslaught,” and “Bracing for weekend flood.” Short-term forecasts early the next day, December 30, were predicting four inches of rain overnight.
Having seen the extraordinary heights at both Bellevue-Wilfred channel and at the Occidental bridge across the Laguna, I took this latest forecast seriously, and swung into action. I wanted to witness the event fully, but I wanted to do it in a way that would provide me with a better understanding of how the Laguna swells and subsides. I wanted to capture enough data to allow me to accurately depict the flood wave movement through the system, and to determine a simple question: why does the Laguna near Sebastopol always seem to be at its glory—its widest and highest—a day or two after a storm?
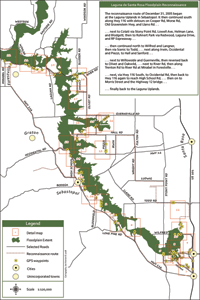
That night I went to my office and created a custom set of maps to enable me to navigate the back roads, while also allowing me to pick up simple readings of elevation. For so long, people had been talking about the 76-foot flood line—the FEMA determined elevation of the so called 100-year event—that I wanted to see for myself what it looked like. With my custom set of eleven maps, I was prepared for a full day of reconnaissance.
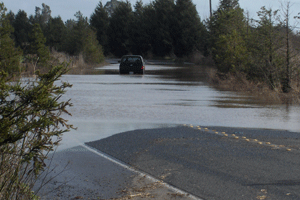
 My goal was to map the inundation level of the impending flood. Armed with a fully charged battery in my camera, a hand held GPS device, eleven custom made maps with one-foot contours, and a full tank of gas, I set out early Saturday morning to capture as much of the floodwater’s crest as I could. I snapped photos of every road/stream crossing south of Sebastopol to Cotati. My return trek through the swamped roads of the Santa Rosa Plain made for slow going, and bridge closures at every major cross point confined me to the eastern side of the Laguna.
It wasn’t until I reached the confluence of the Laguna—Mark West complex, near River Road, that I was finally able to cross westward. Here especially, the immensity of the water captured my attention; I had always heard about the backwater effect of the Russian River at this point, but to see the oceanic-like inundation firsthand was to finally turn me into a believer.

